20 Statistical Concepts Every Data Scientist/Analyst Should Know
Think of statistics as learning the ABCs of data science. You start with the basics and soon you’re reading and writing stories, or in our case, analyzing data and making cool predictions!
In this easy-to-follow guide, we’re going to look at 20 key statistics concepts. Imagine these concepts as the building blocks of understanding data. They’re like Lego bricks — simple by themselves but can create something amazing when you put them together.
So, let’s start our journey into the fascinating world of statistics, where numbers tell tales and we’re here to listen and understand.
1. Population and Sample
A population is the entire set of individuals or objects under study. A sample is a subset of the population used to make inferences about the entire population.
Example: Consider a university with 10,000 students. The entire 10,000 students represent the population. If we select 500 students from this university and analyze their study habits, those 500 students constitute the sample.

2. Descriptive Statistics
Descriptive statistics summarize and present data in a meaningful way. Common measures include mean, median, mode, variance, and standard deviation.
Example: For a dataset of exam scores: Mean = 75 (average score), Median = 80 (middle score), Variance = 100 (spread of scores), Standard Deviation = 10 (how scores deviate from the mean).
3. Inferential Statistics
Inferential statistics involves making predictions or inferences about a population based on a sample.
Example: We want to know the average height of all adults in a country. Instead of measuring everyone, we measure the heights of 500 adults (sample) and infer the average height of the entire adult population.
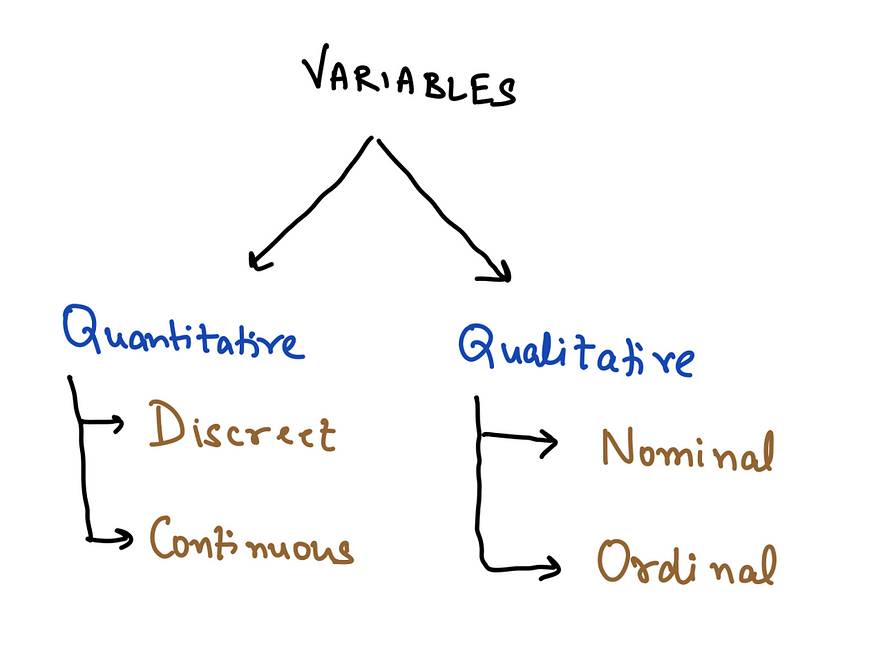
4. Variable Types
Variables are classified as categorical (nominal, ordinal) and numerical (discrete, continuous).
Example: Nominal: Colors (red, blue); Ordinal: A variable having some order — Education levels (high school < bachelor’s < master’s);
Discrete: A discreet variable can only take an integer value — The number of children in a family;
Continuous: A variable that can take any floating value — Height of individuals.

5. Measures of Central Tendency
Measures such as mean, median, and mode represent the central tendency of a dataset.
Example: Mean (average) of {2, 3, 3, 4, 5} = (2+3+3+4+5)/5 = 3.
Median = 3 (middle value).
Mode = 3 (most frequent value).
6. Measures of Dispersion
Measures like range, variance, and standard deviation indicate how spread out the data is.
Example: For the dataset {1, 2, 3, 6, 7}, range = 7–1 = 6, variance = 6.25, standard deviation ≈ 2.5.
7. Correlation
Correlation measures the strength and direction of a linear relationship between two variables.
Example: In a study, we find a strong positive correlation (0.9) between study hours and exam scores, indicating that more study hours correlate with higher scores.

8. Regression Analysis
Regression analysis predicts the relationship between one dependent variable and one or more independent variables.
Example: Predicting house prices based on features like square footage, number of bedrooms, and location.
9. Probability
Probability quantifies the likelihood of an event happening, ranging from 0 (impossible) to 1 (certain).
Example: The probability of rolling a 6 on a fair six-sided die is 1/6 or approximately 0.167.
10. Hypothesis Testing
Hypothesis testing assesses the validity of a claim or hypothesis about a population based on sample data.
Example: Testing if a new drug is effective by comparing the recovery rates of a treated group and an untreated group.
11. Z-Score
Z-score measures how many standard deviations a data point is from the mean, indicating its relative position in a distribution.
Example: In an IQ test with a mean of 100 and a standard deviation of 15, an IQ of 130 has a Z-score of 2.

12. Binomial Distribution
A discrete probability distribution of the number of successes in a sequence of n independent experiments.
Example: Flipping a fair coin 10 times, the probability of getting exactly 7 heads using the binomial distribution.
13. Poisson Distribution
A discrete probability distribution that expresses the number of events occurring in a fixed interval of time or space.
Example: The number of phone calls a call center receives in a minute, assuming a Poisson process.
14. Normal Distribution
A symmetric, bell-shaped distribution often seen in natural phenomena, with a defined mean and standard deviation.
Example: Human heights often follow a normal distribution in a population.
15. Skewness and Kurtosis
Skewness measures the asymmetry of a probability distribution. Kurtosis measures the “tailedness” of a distribution.
Example: A positively skewed distribution has a longer right tail, like income distribution.

16. Central Limit Theorem
The theorem states that, given a sufficiently large sample size, the sampling distribution of the mean will be approximately normally distributed.
Example: When rolling a fair six-sided die repeatedly and calculating means for each set of rolls, the distribution of these means approaches a normal distribution as the number of rolls increases.
17. Confidence Intervals
A range of values, derived from sample data, that’s likely to include the true unknown population parameter.
Example: Estimating a 95% confidence interval for the mean height of adult males.
18. Type I and Type II Errors
Type I error is the rejection of a true null hypothesis. Type II error is the failure to reject a false null hypothesis.
Example: In a trial, convicting an innocent person (Type I) or acquitting a guilty person (Type II).

19. ANOVA (Analysis of Variance)
ANOVA is used to analyze differences among group means in a sample.
Example: Comparing the exam scores of students from three different teaching methods.
20. Chi-Square Test
A statistical test is used to determine whether there’s a significant association between two categorical variables.
Example: Testing the association between smoking habit (yes/no) and lung disease (yes/no).
Conclusion
And that’s a wrap! Congratulations on completing this journey through the top 20 statistics concepts. We’ve covered a lot, from understanding data patterns to making decisions based on numbers.
Remember, statistics is like a toolkit for a detective. It helps you uncover insights and solve mysteries hiding in data. These concepts are the keys to unlocking the magic of numbers and turning them into valuable insights.
Keep practicing and experimenting. The more you play with these concepts, the better you’ll become at wielding this statistical magic wand. Happy analyzing!


